
Visualizing China’s Energy Investments Around the Globe
There’s little doubt that China has become a growing dominant influence in global financial initiatives. Since 2000, China has provided an upwards of $160 billion in development finance to the energy sector for foreign governments across the globe. To understand the scope and breadth of these investments, we worked with Boston University’s Global Economic Governance Initiative to create an interactive visualization–The China Global Energy Database–that allows you to explore China’s global investments.
In approaching this project, we were provided a dataset of finance projects detailed with many attributes, some of which included where the project was financed, what year, who financed it, and what type of energy source and sub sector of the project’s objective. With these attributes alone, there are many ways to view this data such as trends for investments for a given country or trends for specific energy source. You may want to see how energy sources vary by region in any given year. We created cross-linked visualizations to allow you to explore each of these views and how they relate to one another.
Read a detailed policy brief about this project or go and explore the China Global Energy Database.
Several views from this project:
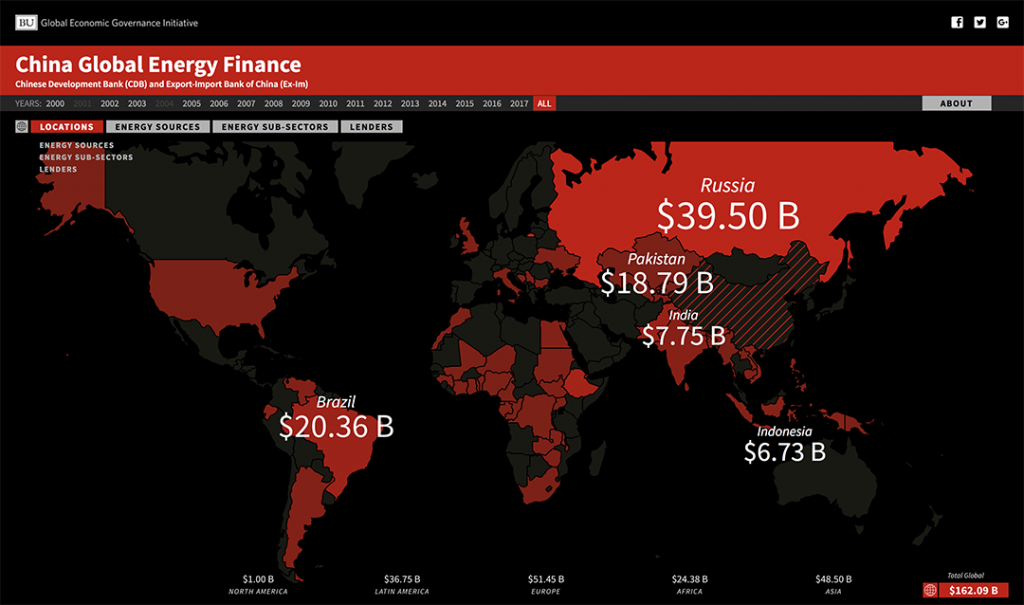
Total global investments between 2000 and 2016.
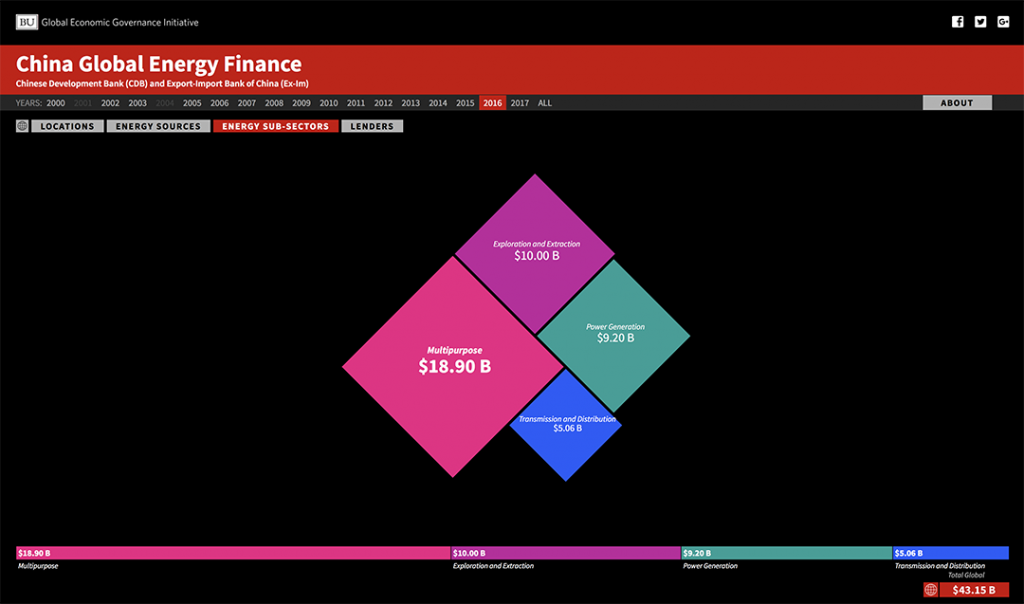
Energy sub-sector trends in 2016.
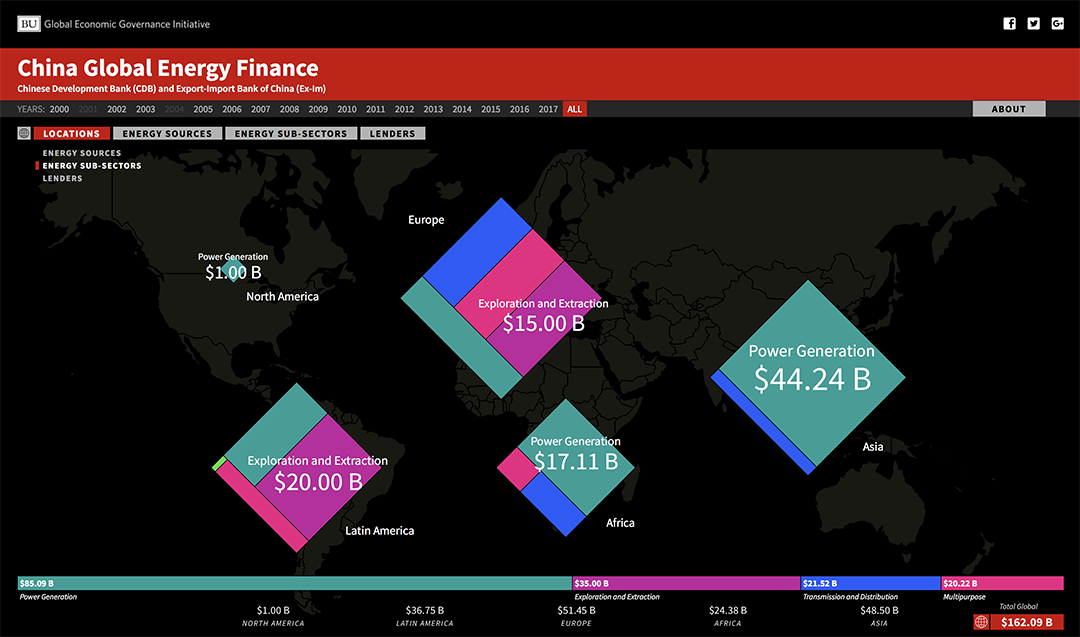
Energy sub-sector trends by region between 2000 and 2016.

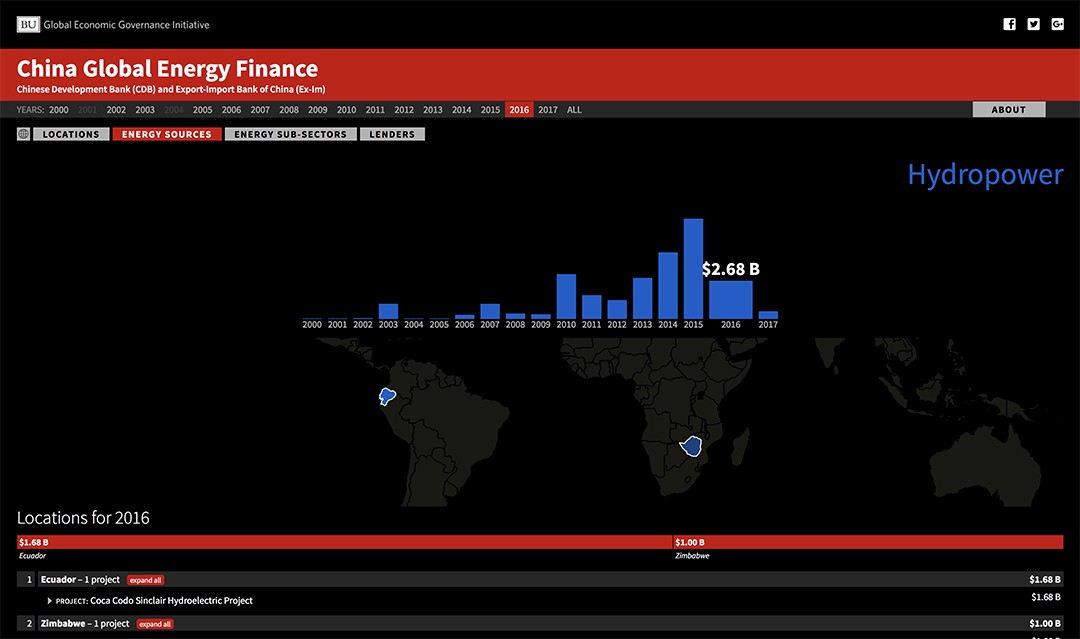
Energy source trends by region in 2016.